First of all, thanks to Nate and company for bringing me on board, and equally thanks for the kind words and enthusiasm for the announcement of same.
As we discussed on the intro pod, I'm going to be providing statistical support to the network here. Much of the stuff I'll be doing will go on behind the scenes in terms of keeping Nate, Danny, Dan and perhaps even John updated on a suite of stats and metrics I've taken to tracking over the years. However, we wouldn't have made a big splash about that. Rather, I'll also be providing some of the same tools and resources to subscribers in the form of dashboards (watch this space for links soon), regular data dump reports, frequent statistical nuggets and even "statistical explainers" to allow you to become more familiar with some of the more esoteric metrics that are floating around the NBA interwebs.
For today, I want to kick off to look at a metric Nate and I discussed on that pod which helps square the circle on one of the more overlooked pieces of a player's offensive contributions: turnovers.
For the most part, we simply don't notice turnovers. Or rather, unless a player is especially loose or careless with the ball, they kind of wash over us. Sure we mentally discount guys who get up into the 4 TO/GM range, but we seldom do the reverse. One of the unsung keys to the longevity and effectiveness of Dirk Nowitzki was the infrequency of his miscues. Among the 75 players in the LeBron era to play at least 5,000 career minutes with a usage rate of 25 or higher, Dirk's 8.0 turnover percentage is the lowest, in a virtual tie with another player who added offensive value by helping his teams always get shots, even if they were often mediocre midrangers, in LaMarcus Aldridge. And of course Chris Paul's "point god" status is bolstered by his career-long ability to prevent his own teams from coughing up the ball while at the same time causing the opposition to do so with frequency.
Part of the reason we often don't really include turnovers in our evaluation is they are hard to contextualize. Luka Doncic and Trae Young both turn the ball over more than 4 times per 100 team scoring chances. But they also carry huge creation loads for the respective offenses. So are those 4 turnovers a lot, a little or simply an expected and acceptable amount?
Several years ago, I decided to come up with a better way to track turnover rates than the traditional measures. On one hand, TO/100 (either possessions or chances) doesn't really speak to a player's offensive load or role. Of course Devin Booker has a much higher turnover rate than Mikal Bridges; Booker has the ball around 3.5 times as much! Likewise, TOV% as tracked by many websites attempts to accommodate role, but really only serves to inflate the value of chuckers relative to passers. TOV% is calculated as TOV / (FGA + .44 * FTA + TOV), or really just TOV's per 100 / usage. Where does passing fit in there? Well a bad pass hurts you, counting as +1 turnover. A great pass that sets a teammate up? That's a...nothing.
So why not include playmaking as another output against which to measure turnover rates? Now in our 10th year of tracking data, we can do this directly, with potential assists serving the same role as FGA in our normal usage calculations. As the passer, your job is done once you set a teammate up. Make or miss is up to them. (Note that though my version of Playmaking Usage - (Potential Assists + FT Assists)/Scoring Chances - is only calculable since 2013-14, you can get a pretty decent estimate going back to previous years by multiplying a player's recorded assists by 1.9 or even 2).
The result is a Total Usage stat, which while interesting in it's own right - during his time on the floor, over 57% of Mavs scoring opportunities have involved Doncic! - gives us a better basis for comparison of turnover rates.
Remember how I noted Trae Young turns the ball over on just over 4% of Atlanta's offensive chances while he's in the game? Jaylen Brown, who carries a similar scoring load for Boston, does so on 3.9% of his chances. As the chart below of the 10 highest-scoring usage players in the league through Sunday shows, by the traditional measure (TOV%), Young and Brown are similarly turnover prone. Which doesn't make a ton of sense since one is perhaps the premier pick-and-roll operator in the NBA today, while the other's handle and passing vision have often been noted as key weaknesses.
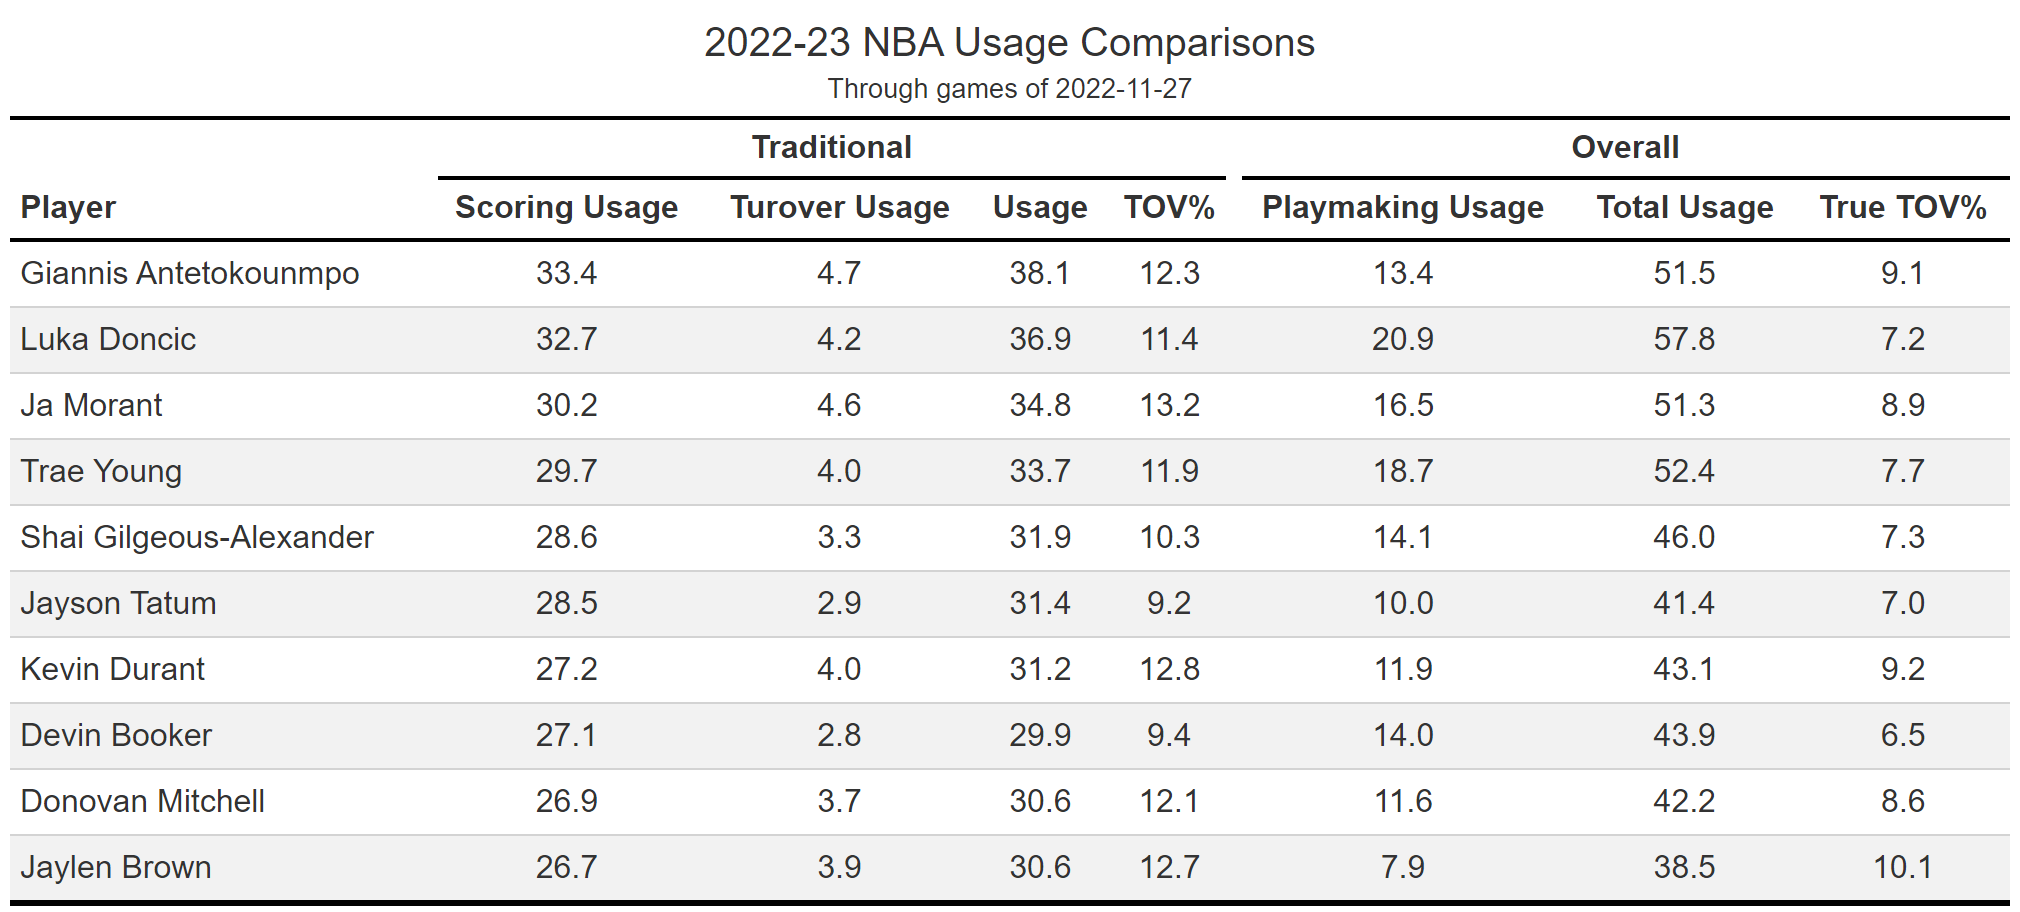 Adding their passing chops back in, and we can see that relative to their offensive involvement, Brown turns the ball around a third more often relative to his offensive involvement. Which certainly better matches our understanding of what we're watching than if we considered them equally profligate.
For sake of context, point guards tend to have True TOV% in the high 8s, wings in the mid 9s and bigs high 9s to low 10s; players who don't handle the ball much but are used in lots of screening action get mildly penalized due to illegal screens counting as turnovers, but come from players not as directly "involved" offensively in these calculations.
Look for Playmaking Usage, Total Usage and True TOV% among other stats in data dashboards coming soon.
Is there a concept or stat you'd like to see if we can track? Let us know either via email or on the discord and we'll be sure to give it a look.
-Seth Partnow